.png)
Average ROAS is a useful starting point but a poor basis for budget allocation decisions, because it assumes each additional euro invested will generate the same return as the last. In reality, channels follow non-linear response curves: some saturate quickly, others require a minimum spend threshold before they generate any meaningful return. Incremental ROAS, derived from investment sensitivity analysis, reveals the true marginal return of each additional euro and is a more reliable guide for deciding where to shift budget. The difference between allocating on average ROAS versus incremental ROAS can be substantial, as the worked examples in this post illustrate.
Return on Ad Spend, or ROAS, measures the revenue generated for each euro spent on advertising. It is one of the most widely used metrics for campaign-level budget decisions, partly because it is straightforward to calculate and easy to compare across channels.
ROAS is often favoured over ROI for campaign decisions because ROI measures overall marketing spend against revenue, which makes it less useful for evaluating individual channels or campaigns. ROAS connects revenue directly to specific ad spend, giving you a channel-level view that ROI cannot.
The limitation is not in the metric itself but in how it is typically applied. When teams use average ROAS to decide where to shift budget, they are making an assumption that does not hold in practice.
To illustrate why, consider a budget decision for an upcoming campaign requiring allocation between two channels: TV and online Video.
Looking at historical results, TV and Video received similar investment levels. Video generated higher average revenue (€8,000) compared to TV (€3,000), giving Video a higher average ROAS of €3.20 versus TV's €1.20.
On the surface, this looks like a straightforward case for shifting budget towards Video. It is not — and understanding why is the core argument of this post.
The issue with using average ROAS for allocation decisions is what statistician Sam Savage calls the "flaw of averages." Savage argues that "plans based on assumptions about average conditions usually go wrong." He illustrates this with the story of a statistician who drowned crossing a river he calculated to be three feet deep on average. The average was accurate. The decision based on it was not.
Average ROAS carries the same flaw. When you use it to allocate budget, you are assuming that each additional euro invested in a channel will generate the same return as previous euros. This implies a linear relationship between spend and revenue.
In reality, that relationship is almost never linear. Channels saturate. Some require a minimum investment before they generate any return at all. The average ROAS figure tells you what happened historically across a range of spend levels. It does not tell you what will happen if you increase spend from where you are now.
To make better allocation decisions, you need to move from average ROAS to incremental ROAS. The practical tool for doing this is an investment sensitivity curve.
Investment sensitivity curves map expected revenue at different spend levels for each channel. They make the non-linear nature of channel response visible, showing exactly where additional investment generates meaningful return and where it starts to plateau.
These curves are sometimes referred to as shape effects or investment elasticity curves. Whatever the label, the principle is the same: rather than asking what a channel returned on average, you ask what it will return on the next euro you invest.
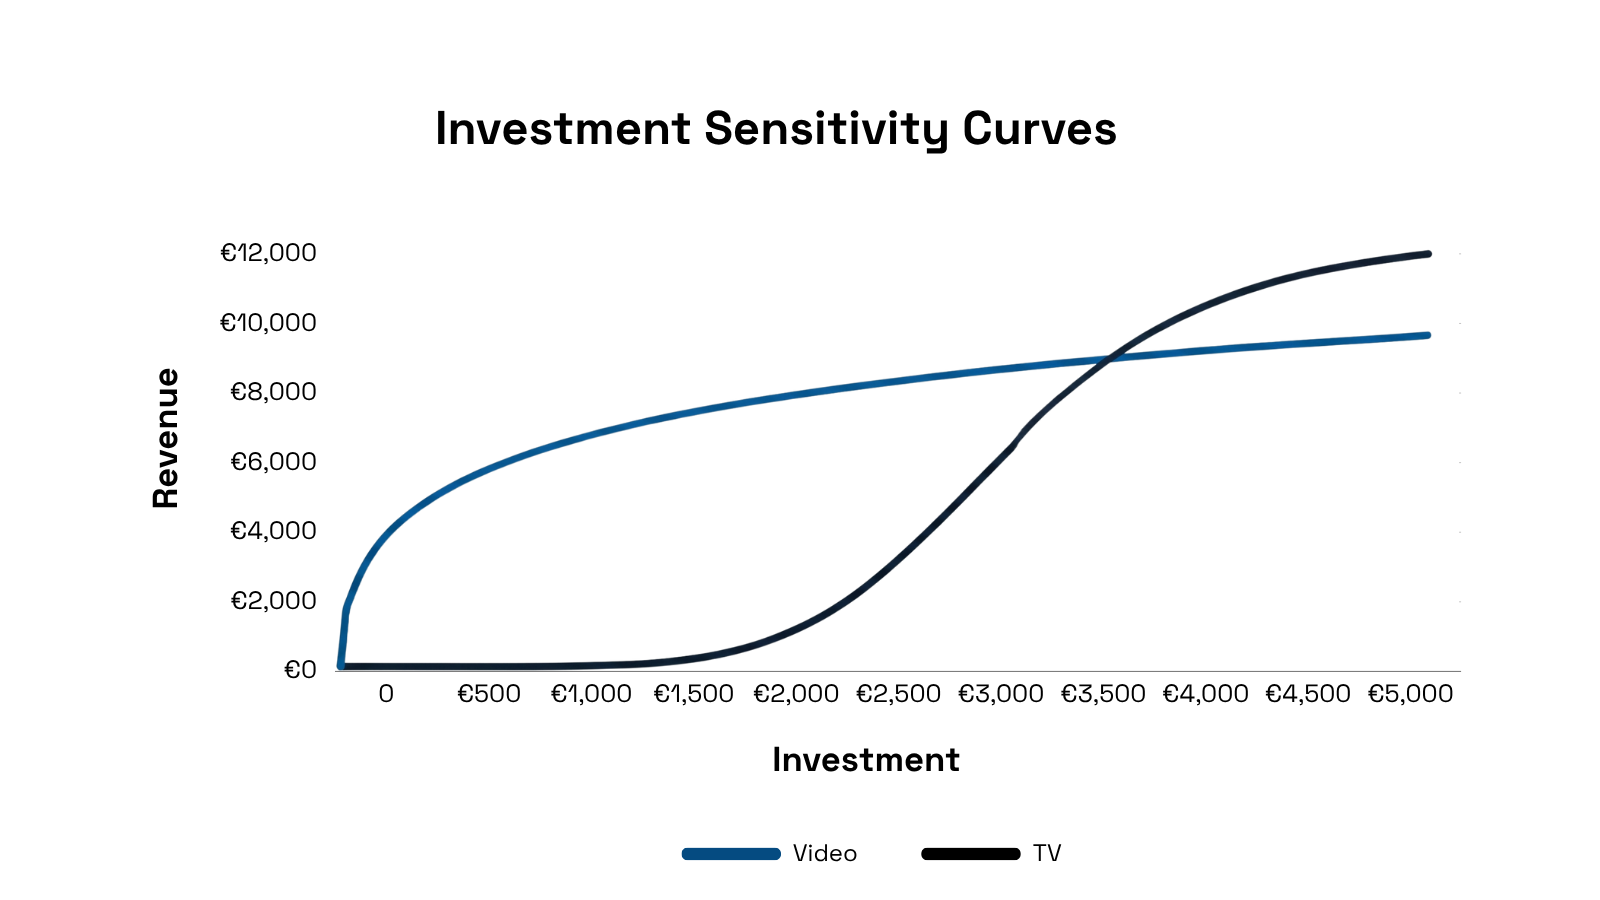
In our TV and Video example, the curves reveal a pattern that average ROAS completely obscures. The Video curve rises quickly at lower investment levels but flattens as spend increases, a classic diminishing returns pattern. TV follows an S-curve: it requires a minimum investment before generating meaningful revenue, becomes more efficient up to around €3,000 and then also starts to plateau.
This S-curve pattern is common in traditional broadcast channels like TV and radio, which typically require a threshold spend level before they register any meaningful audience impact. Smaller budgets in these channels tend to generate little return, while budgets above the threshold can be highly efficient.
With the sensitivity curves in hand, we can now run three scenarios using the same total budget of €5,000 and compare the outcomes.
In previous campaigns, the budget was split equally: €2,500 for TV and €2,500 for Video.

At this split, TV generates €3,000 in revenue and Video generates €8,000, for a combined total of €11,000 and an overall ROAS of €2.20.
Following the average ROAS logic, the next step would be to shift budget towards Video, the channel with the higher average ROAS. In this scenario, €500 moves from TV to Video, giving TV €2,000 and Video €3,000.
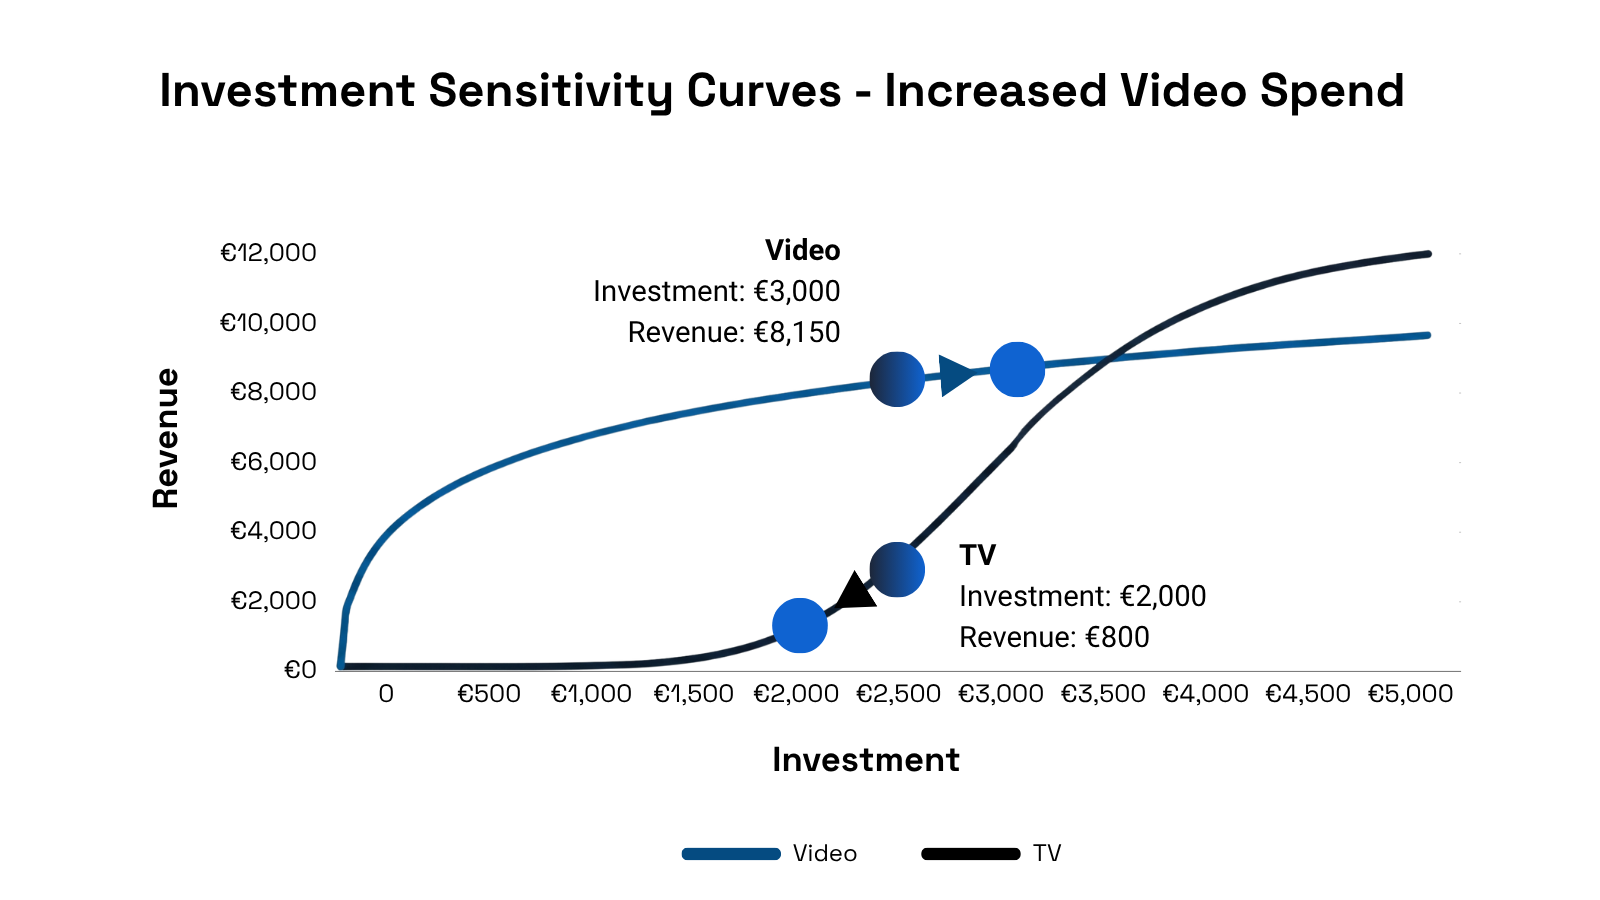
The sensitivity curves show what happens. Video, already operating in its diminishing returns zone, generates only €8,150 — an increase of just €150 despite an additional €500 in investment. TV, now below its effective threshold, drops sharply to €800. Total revenue falls to €8,950 and overall ROAS drops to €1.79.
The channel with the higher average ROAS produced a worse overall result. This is the flaw of averages in practice.
In the third scenario, the same €500 shift goes in the opposite direction: from Video to TV, giving TV €3,000 and Video €2,000.
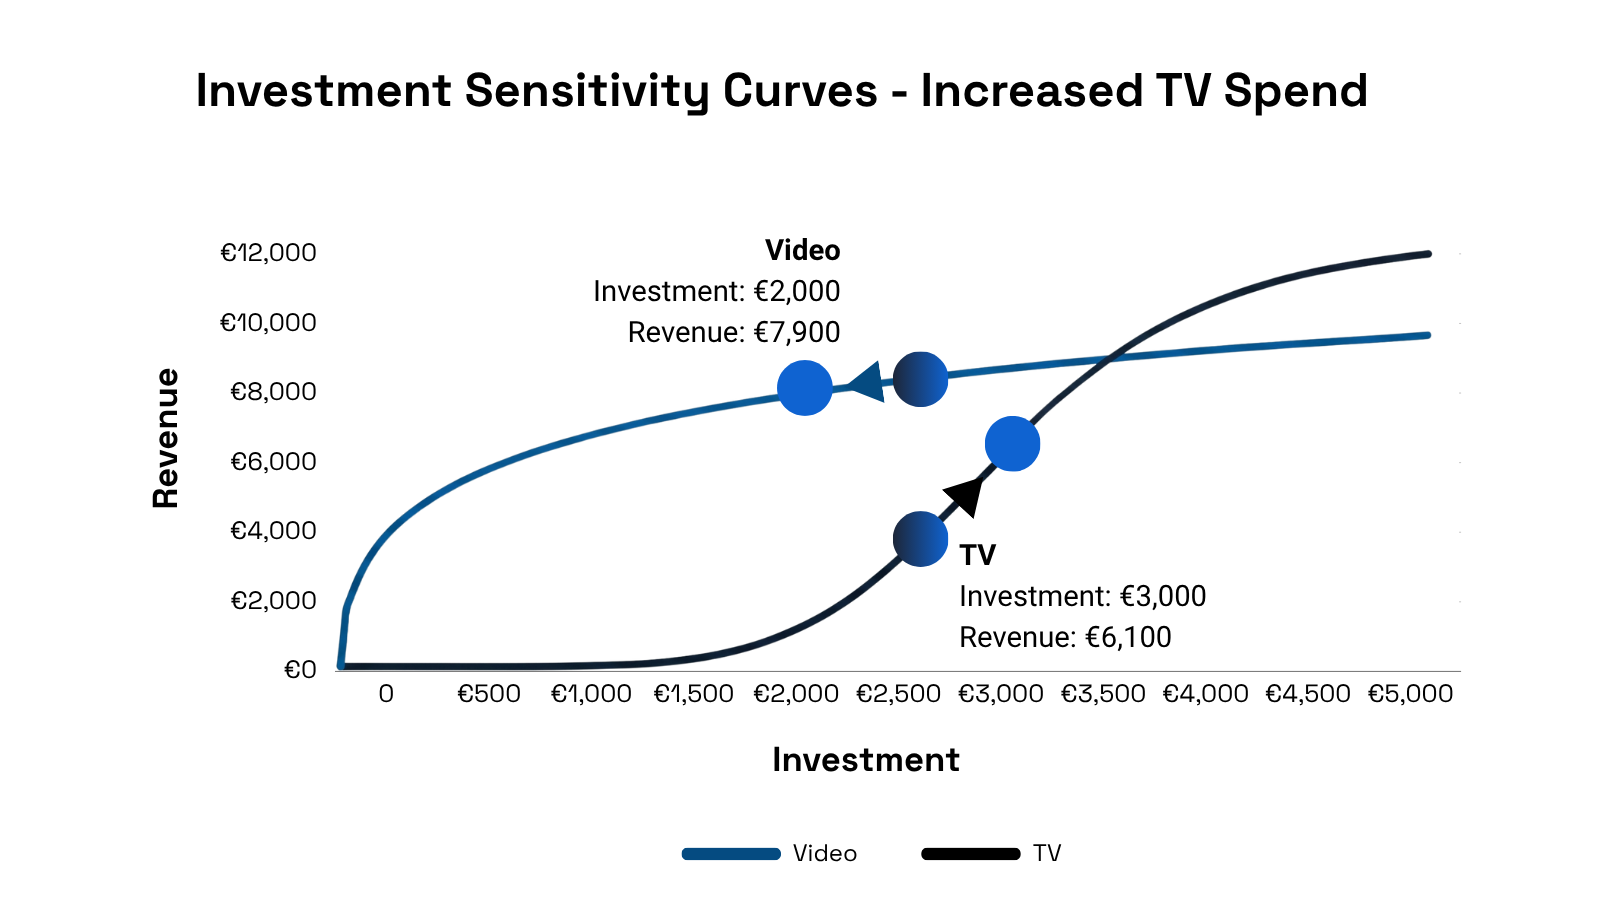
TV, now operating above its threshold and in its efficient zone, generates €6,100. Video, reduced but not below its effective range, generates €7,900. Combined revenue rises to €14,000 and overall ROAS improves to €2.80 — the strongest result of all three scenarios.
The three scenarios used the same total budget. The only difference was where the €500 shift went. Following average ROAS produced a 19% decline in revenue. Following incremental ROAS and investment sensitivity produced a 27% increase.
Attribution data is a valuable starting point for budget planning. The limitation is using historical average performance as a proxy for future marginal return. Investment sensitivity curves close that gap by showing what each channel will generate at different spend levels, making incremental ROAS a practical tool rather than a theoretical concept.
The worked example here uses two channels for clarity, but the same logic applies across any media mix. Channels that appear efficient on average ROAS may be saturated. Channels that look weaker on average ROAS may have significant room to grow. Understanding where each channel sits on its response curve is what makes budget allocation a quantitative decision rather than an intuitive one.
ROAS is also not the only input into budget decisions. Category dynamics, brand consideration levels and the balance between short and long-term objectives all affect where investment should go. For a practical guide to managing that broader balance, see Brand and Performance Marketing: How to Balance Both Without Sacrificing Either. For guidance on using experiments to validate channel performance before committing budget, see How to Use Experiments in Marketing Measurement.
What is the difference between average ROAS and incremental ROAS?
Average ROAS measures the total revenue generated divided by total ad spend for a channel or campaign. It reflects historical performance across a range of spend levels. Incremental ROAS measures the revenue generated by each additional euro invested at the current spend level. Because channel response curves are non-linear, these two figures can differ significantly and incremental ROAS is the more relevant input for deciding where to shift budget.
What is a media saturation curve and how does it differ from an investment sensitivity curve?
A media saturation curve refers specifically to the zone where additional investment in a channel produces progressively smaller returns. An investment sensitivity curve is broader: it maps the full relationship between spend and revenue across all investment levels, including the initial threshold zone where spend must reach a minimum before generating any meaningful return, the efficient middle zone and the diminishing returns zone at the top. Media saturation describes one part of what an investment sensitivity curve reveals, not the curve itself. Understanding both concepts helps identify not just where a channel is saturated but also where it still has room to grow.
Why does average ROAS lead to poor budget decisions?
Average ROAS assumes that each additional euro invested will generate the same return as previous euros. In practice, channels saturate at higher spend levels and some require a minimum investment before generating any return. Allocating budget based on average ROAS ignores these dynamics and can lead to overspending in saturated channels while underspending in channels with room to grow.
What is channel saturation and how does it affect budget allocation?
Channel saturation occurs when additional investment in a channel produces progressively smaller returns. It is visible in investment sensitivity curves as a flattening of the response curve at higher spend levels. A channel with high average ROAS may already be saturated, meaning further investment will generate diminishing returns. Identifying saturation points across your channel mix is essential for efficient budget allocation.
How do you build investment sensitivity curves?
Investment sensitivity curves are built using historical spend and revenue data modelled across different investment levels. Marketing Mix Modelling is one of the most reliable approaches, as it isolates the contribution of each channel to revenue while accounting for external factors like seasonality and competitor activity. For a practical overview of your MMM options, see DIY MMM: Should You Build Your Own Marketing Mix Model or Use a Platform? The curves reveal different response patterns depending on the channel: some show a threshold effect where spend must reach a minimum level before generating meaningful return, others show diminishing returns as spend increases, and some show both. Media saturation refers specifically to this latter zone, where additional investment produces progressively smaller returns. The Media Scenario Planner within Objective Platform generates these curves automatically, allowing you to run budget scenarios before committing spend.