What platform reporting won’t show you and why it changes how you allocate budget.
As Performance Max investment rises across the industry, Paid Search CTR is quietly falling. We examine the measurement gap between the two channels, what a query composition shift actually looks like in client data and why Marketing Mix Modelling gives a clearer picture of true incremental value than platform reporting alone.
Paid Search is now the largest channel by investment share in our data, but its efficiency is sliding: CPCs are up sharply while clicks fall. Some of that pressure lines up with the rise of Performance Max, which bids across inventory that overlaps with Search. In client data, rising PMax spend often coincides with falling Paid Search CTR, partly because PMax wins shared auctions and partly because it absorbs high-CTR brand queries and leaves Search a lower-intent pool. Last-click and platform reporting cannot see this interaction, because they credit the nearest touchpoint rather than the combined effect. Marketing Mix Modelling and geo-lift incrementality tests can, which is why the honest unit of evaluation is the return on your total Google investment rather than each channel in isolation.
Paid Search has become the single largest channel by investment share in our dataset. It overtook TV for the first time in 2025, at 24.5% versus 22.1%.
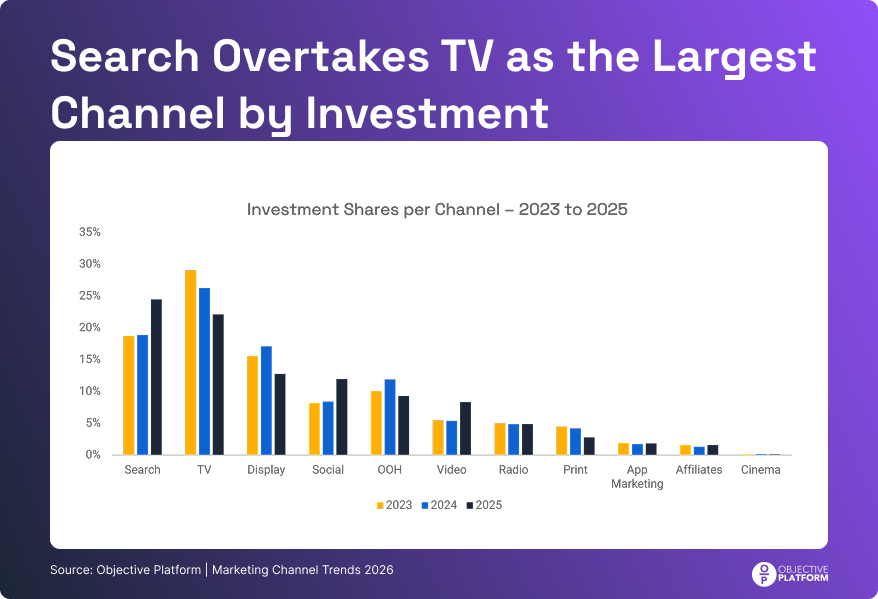
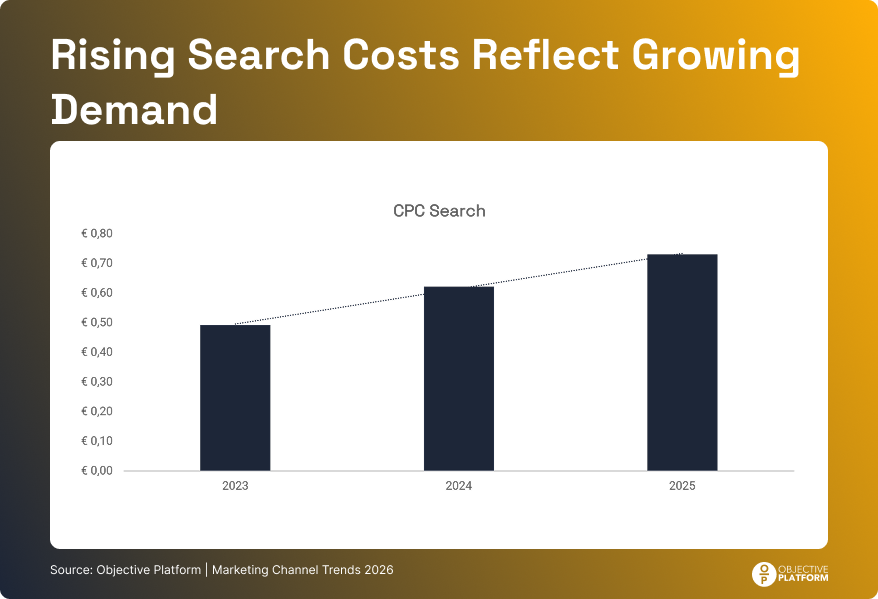
Part of that shift reflects genuine advertiser confidence in Search. Part of it reflects the growing share of budget routed through Performance Max (PMax), which operates across inventory that overlaps heavily with traditional Paid Search. Meanwhile the cost of Search is rising sharply. Average CPC across our client dataset increased 48% between 2023 and 2025, from €0.49 to €0.73. In 2024 to 2025 alone, CPCs rose a further 17% while total clicks fell by 26%. Brands are paying more per click and receiving fewer of them.
These two trends, rising PMax investment and declining Search efficiency, may not be unrelated.
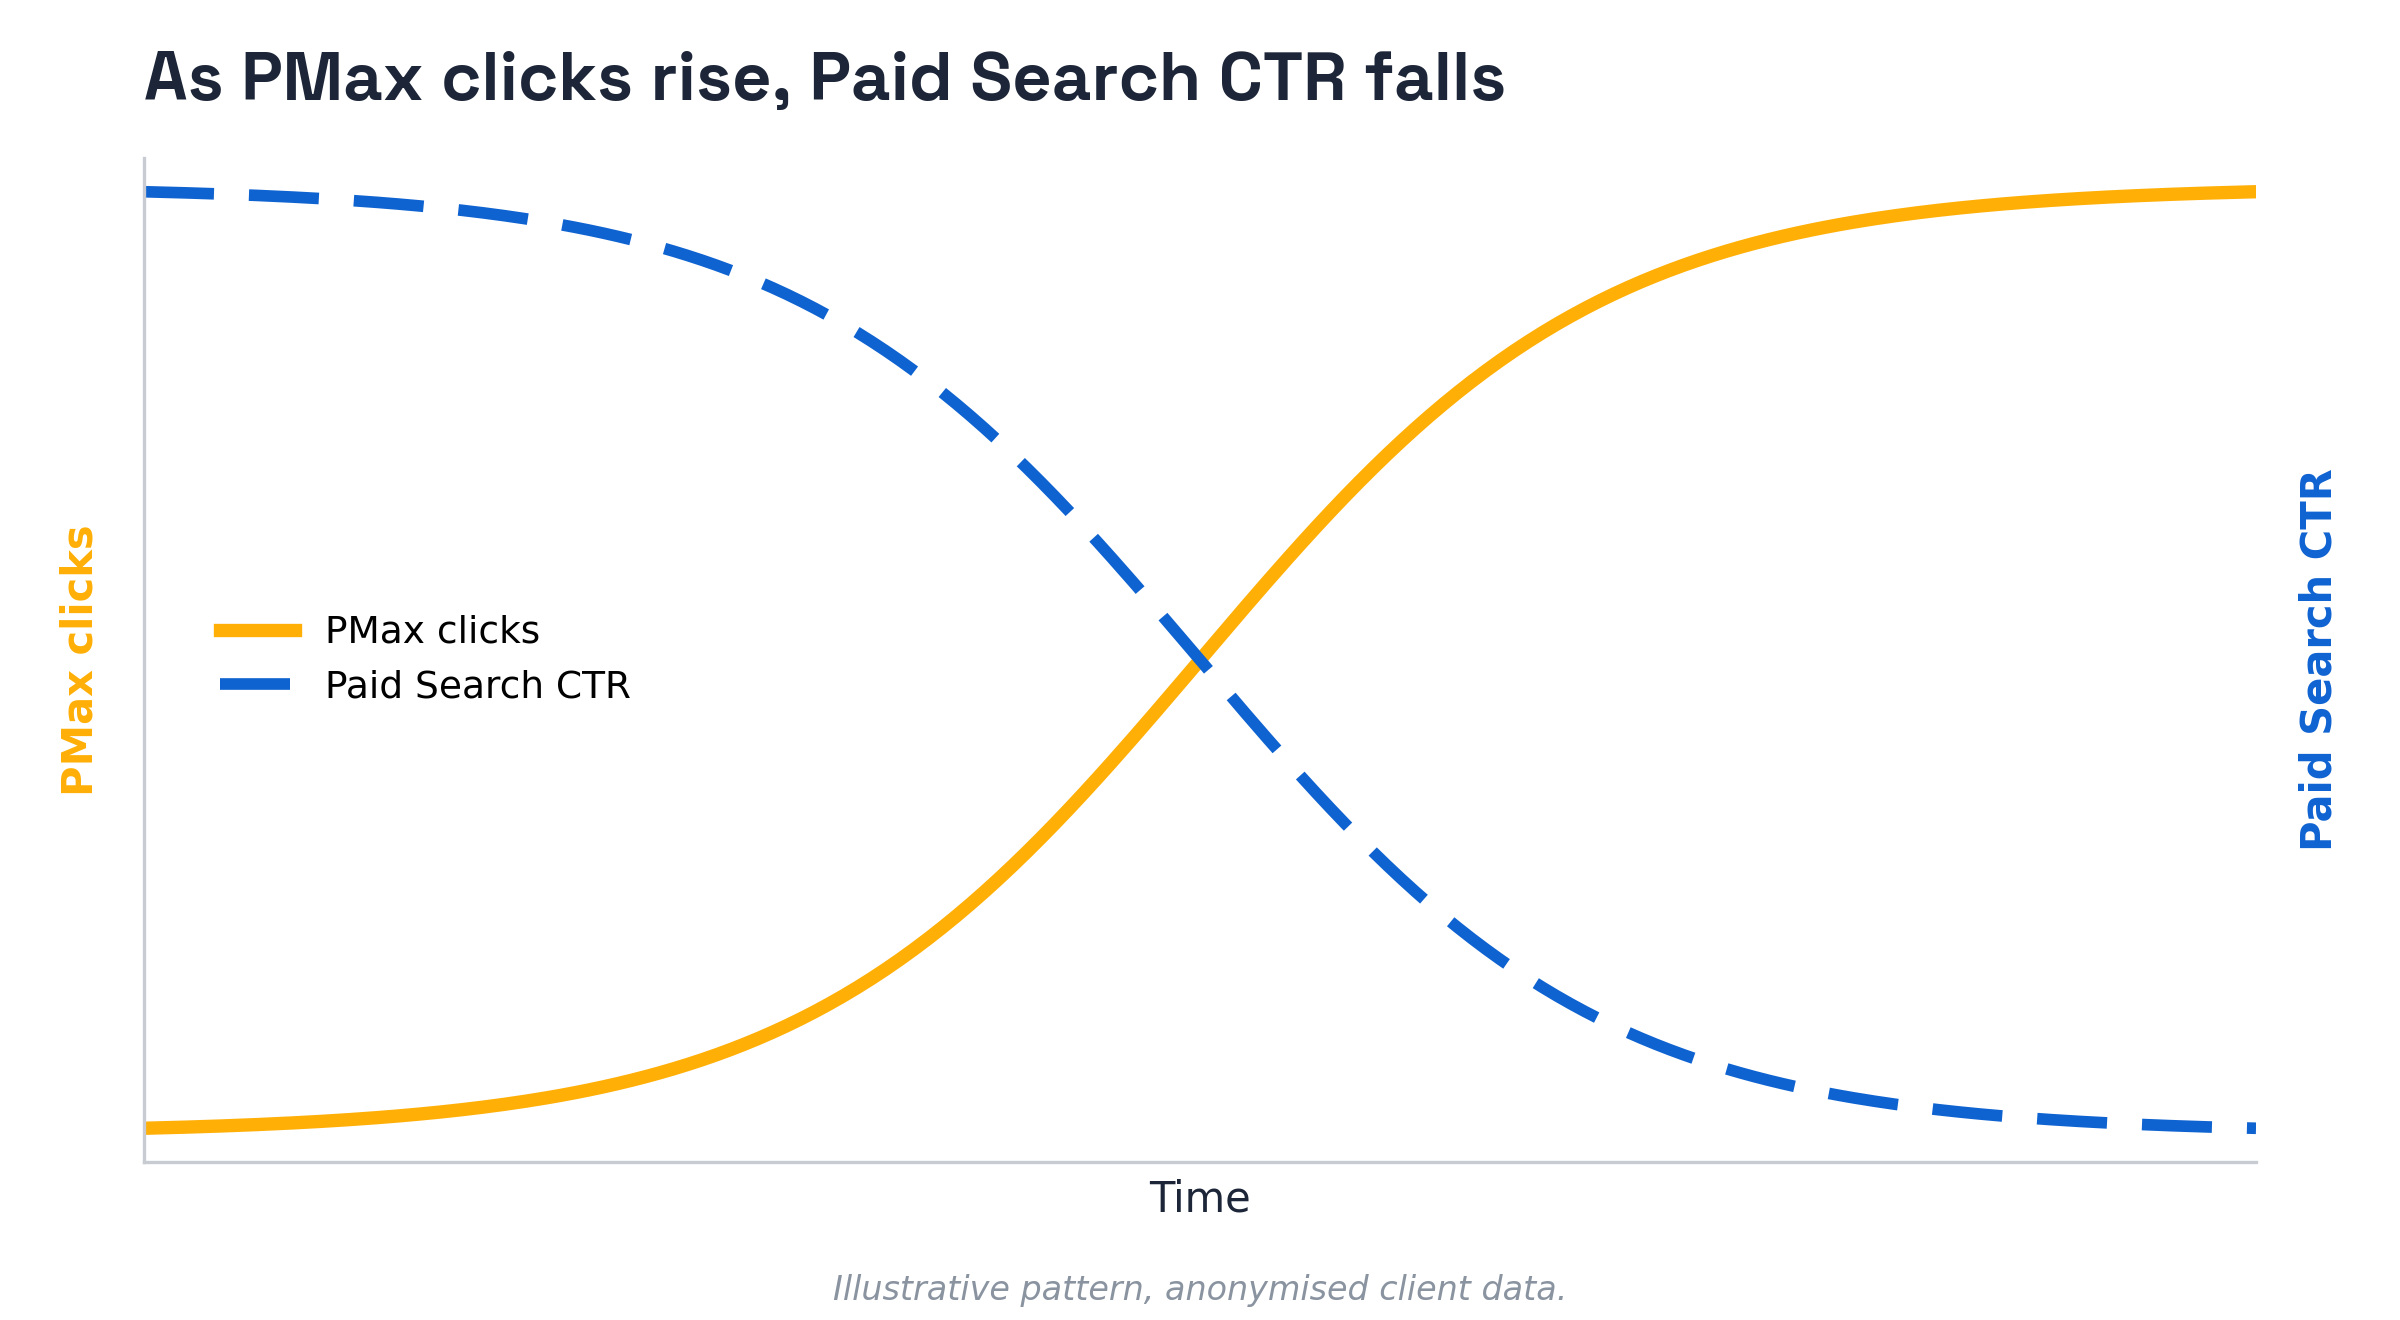
In reviewing client data, we identified a few cases where increasing Performance Max investment coincided with a clear decline in Paid Search CTR. As PMax spend grew and captured more search auction inventory, click-through rates on Paid Search ads fell, suggesting PMax was winning auctions that standard Search campaigns would otherwise have claimed. PMax’s ability to automate across inventory is a powerful growth lever. The challenge for modern marketers is to measure its incremental contribution accurately relative to existing Search structures.
This is not a reason to pullback from Performance Max. As a campaign type, PMax is designed to find growth across the full funnel, including placements that standard Search campaigns would not target. What it raises is a measurement question: if you run both channels at once and PMax is winning the overlap, what are you actually measuring when you evaluate each channel in isolation?
Whether Performance Max helps or mostly cannibalises comes down to one thing: how saturated your existing Search coverage already is. PMax and Search bid on the same inventory and the same keywords, so they sit on one shared response curve rather than two separate ones. Early on that curve, more spend buys meaningfully more return. Past a point it flattens and each extra euro buys less. Where you already sit on it decides what PMax does for you.
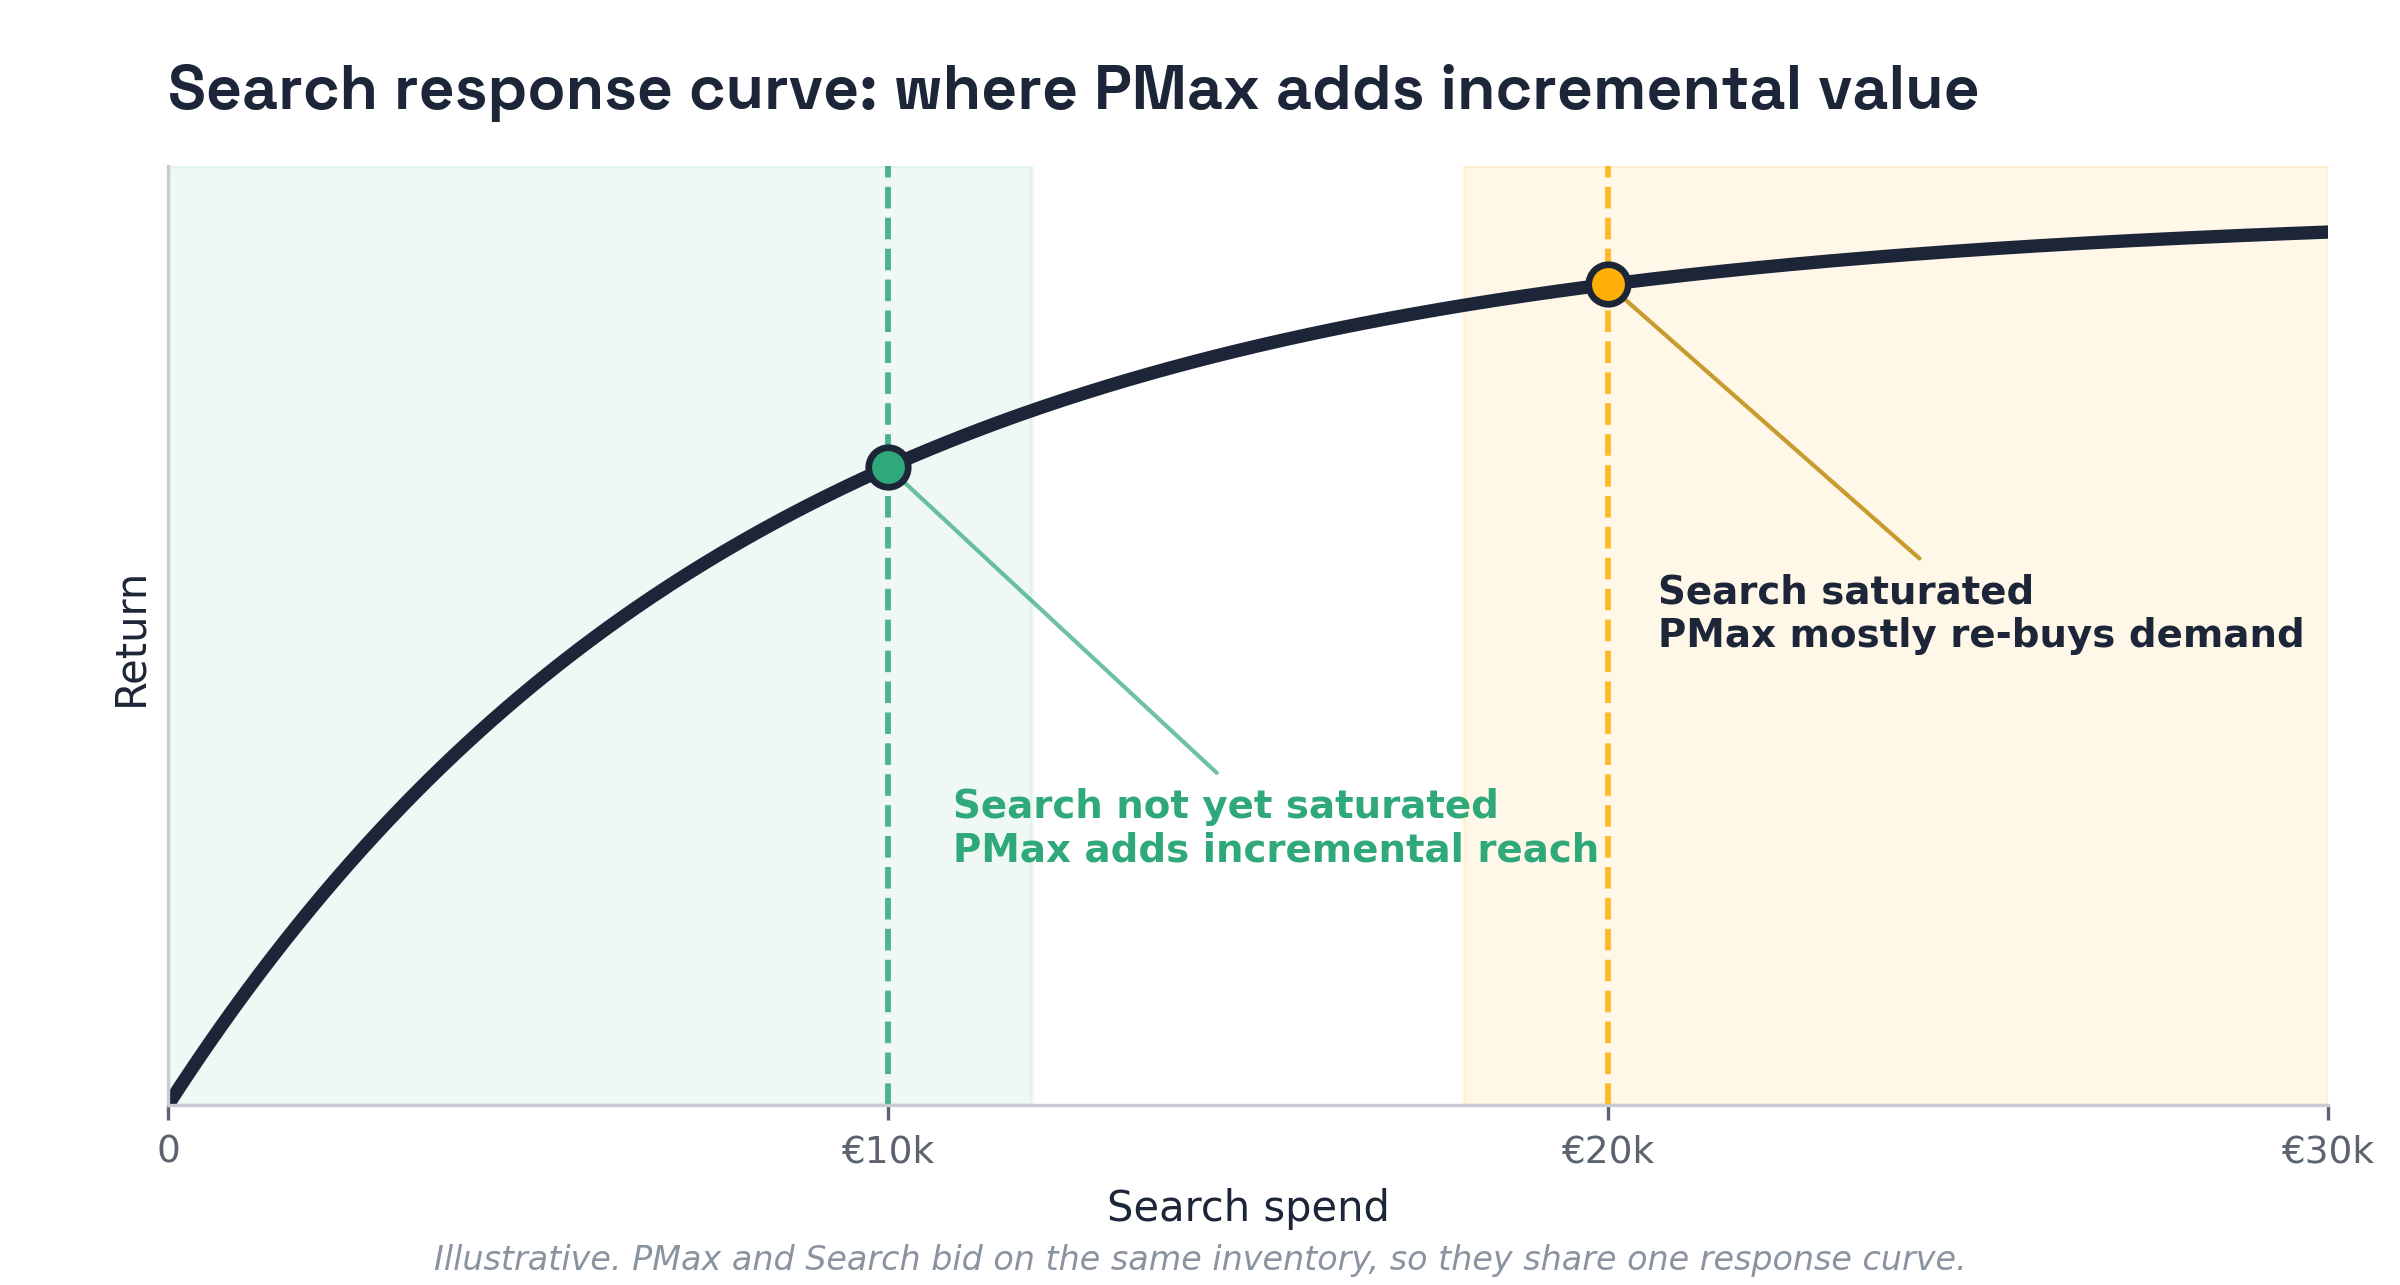
If your Search channel is not yet saturated, there is genuine headroom and PMax can reach demand your existing campaigns were not capturing. At the €10k point on the curve above you are still climbing, so adding PMax adds incremental reach.
If your Search is already saturated, the picture changes. A brand running an extensive Search setup, broad match with high coverage, is already near the top of the curve. At the €20k point PMax meets stricter diminishing returns. It bids on queries you were mostly winning anyway, so its reported conversions look strong while its true incremental contribution is small. That looks like growth in the platform but is mostly cannibalisation.
This is the strongest reason to stop treating PMax as a separate channel. Because it buys the same Search inventory, its incremental performance depends on your existing Search coverage, not on some independent pool of demand. A user searching for an iPhone sees the same result whether a dedicated Search campaign or a PMax campaign won the auction. Structuring PMax and Demand Gen at the campaign-type level, as buying methods across Google’s core channels of Search, YouTube and Display, reflects how people actually behave. Modelling them on one shared response curve is what lets you quantify how PMax and Search interact, rather than crediting each as an isolated pool of incremental performance.
Not all of the Paid Search CTR decline comes from direct auction competition. There is a second, subtler mechanism: brand-driven queries carry naturally high CTRs and low CPCs. If Performance Max is increasingly absorbing brand queries, which placement reports and search query reports can help verify, the remaining Paid Search pool skews lower-intent by composition. The observed CTR drop then looks like PMax cannibalising Search, when it may partly reflect a structural shift in which query types Search is still capturing.
Part of the CTR decline may reflect a shift in query composition. If PMax absorbs brand-driven queries, which carry naturally high CTRs, the remaining Search pool looks weaker by comparison, even without direct auction competition. Either way, the measurement gap is the same.
The practical implication is the same either way: the split between branded and non-branded terms matters enormously. It is worth examining search query reports to understand how PMaxis bidding across that boundary. Adding negative keywords to keep brand and non-brand terms in their respective channels is one way to recover visibility and clarity.
Google’s own reporting and most last-click attribution models credit conversions to whichever channel touchpoint sits closest to the sale. If Performance Max is increasingly winning the auction for high-intent queries, it will appear highly effective in platform reporting. Paid Search may look weaker at the same time, as fewer intent-rich clicks reach it. Neither channel’s reported performance captures what is happening at the portfolio level.
This creates a genuine measurement challenge for teams trying to decide whether to scale PMax, protect Paid Search budgets or find the optimal split between the two. Platform reporting measures individual channel execution well. It is not designed to reveal the synergy and interaction between overlapping campaigns at a portfolio level.
Marketing Mix Modelling is better placed to capture these dynamics, because it evaluates the combined and incremental contribution of media over time rather than crediting the nearest touchpoint. When Performance Max and Paid Search are modelled together, as parts of a single Google ecosystem investment, you can see whether the overall return from both channels improves as PMax grows rather than simply whether PMax looks efficient in isolation.
A more targeted approach is the geo-lift incrementality test: designing a PMax lift study to isolate net incremental contribution while accounting for any displacement of Paid Search conversions in the same period. The core question is whether PMax drives conversions that would not have happened through Paid Search, at a level that justifies what is being lost in the Search channel. Structured experiments are how you settle it.
Our 2026 Marketing Channel Trends report recommends treating Search as one component of a balanced mix rather than the default destination for performance budget. It suggests using blackout or geo-lift experiments to distinguish what Search is truly adding from what it is simply capturing.
The clearest view of incremental value tends to lead to the sharpest budget decisions. Platform reporting, by design, is not built to give you that view.
That distinction matters. Capturing existing demand is valuable, but it is not the same as creating new demand. If two channels within the same platform are competing to capture the same intent signal, the honest unit of evaluation is the combined return on the total Google investment rather than each channel on its own.
Does Performance Max cannibalise Paid Search?
It can, particularly when both campaign types are bidding on overlapping search queries. As PMax investment grows, it may win auctions that traditional Paid Search campaigns would otherwise have claimed, reducing Paid Search click volume and CTR. The extent depends on how campaigns are structured, which keyword exclusions are in place and how much of the PMax activity overlaps with branded search terms.
When does Performance Max add value and when does it just cannibalise Search?
It depends on how saturated your existing Search coverage already is. If your Search still has headroom, PMaxc an reach demand your campaigns were not capturing and adds genuine incremental value. If your Search is already saturated, with broad match and high coverage, PMax meets stricter diminishing returns and mostly re-buys demand you would have won anyway. Because both bid on the same inventory, the honest test is whether the combined return improves as PMax scales, which a geo-lift test can settle.
Why is my Paid Search CTR dropping while PMax spend increases?
There are two likely explanations that often work in combination. First, PMax may be winning Search auctions that previously went to your Paid Search campaigns, reducing the volume of clicks available to standard Search. Second, if PMax is absorbing brand-driven queries, which carry naturally high CTRs, the remaining PaidSearch pool skews lower-intent, pulling average CTR down even if individual campaigns are performing consistently.
How do you measure the true incremental value of Performance Max?
The most reliable method is a geo-lift incrementality test designed to isolate PMax’s net contribution, accounting explicitly for any displacement of Paid Search conversions in the holdout period. Platform-reported ROAS is not sufficient because it does not capture the interaction between PMax and your other Google channels. Marketing Mix Modelling offers a complementary view by evaluating both channels together as part of the same media investment.
Should I reduce PMax budget if it is affecting Paid Search CTR?
Not necessarily. The right question is whether the combined return from PMax and Paid Search together is improving as PMax scales, not whether Paid Search metrics look weaker in isolation. If a geo-lift study shows that PMax is driving genuinely incremental conversions at an acceptable cost, the overall portfolio may be healthier even if individual search metrics decline. The issue is making that determination from platform data alone, which cannot show the interaction between channels.
What role does Marketing Mix Modelling play in evaluating PMax?
MMM models PMax and Paid Search as parts of the same media system rather than crediting each channel independently. This makes it possible to see whether growing PMax investment improves the overall return on your total Google spend rather than just whether PMax looks efficient when its conversions are attributed in isolation from the search activity it may be displacing.